Grafana 中监控待处理的工作负载
使用 Grafana 中的 VisibilityOnDemand 特性监控待处理的工作负载。
本指南解释了如何使用 VisibilityOnDemand 特性在 Grafana 中监控待处理的工作负载。
本文的受众是批处理管理员, 用于 ClusterQueue 可见性,以及批处理用户用于 LocalQueue 可见性。
开始之前
确保满足以下条件:
- 正在运行一个 Kubernetes 集群。
- 已安装 Kueue
- 已安装 Kube-prometheus operator 版本 v0.15.0 或更新版本。
- 已启用 VisibilityOnDemand 特性。
配置 Grafana 监控待处理工作负载
步骤 1:配置集群权限
为了启用可见性,为 ClusterQueue 或 LocalQueue 创建 ClusterRole 和 ClusterRoleBinding:
- 对于
ClusterQueue可见性:
apiVersion: rbac.authorization.k8s.io/v1
kind: ClusterRole
metadata:
  name: grafana-cluster-queue-reader
rules:
  - apiGroups: ["visibility.kueue.x-k8s.io"]
    resources: ["clusterqueues/pendingworkloads"]
    verbs: ["get", "list", "watch"]
  - apiGroups: ["kueue.x-k8s.io"]
    resources: ["clusterqueues"]
    verbs: ["get", "list", "watch"]
---
apiVersion: rbac.authorization.k8s.io/v1
kind: ClusterRoleBinding
metadata:
  name: grafana-cluster-queue-reader-binding
subjects:
  - kind: ServiceAccount
    name: default
    namespace: default
roleRef:
  kind: ClusterRole
  name: grafana-cluster-queue-reader
  apiGroup: rbac.authorization.k8s.io
- 对于
LocalQueue可见性:
apiVersion: rbac.authorization.k8s.io/v1
kind: ClusterRole
metadata:
  name: grafana-local-queue-reader
rules:
  - apiGroups: ["visibility.kueue.x-k8s.io"]
    resources: ["localqueues/pendingworkloads"]
    verbs: ["get", "list", "watch"]
  - apiGroups: ["kueue.x-k8s.io"]
    resources: ["localqueues"]
    verbs: ["get", "list", "watch"]
  - apiGroups: [""]
    resources: ["namespaces"]
    verbs: ["get", "list", "watch"]
---
apiVersion: rbac.authorization.k8s.io/v1
kind: ClusterRoleBinding
metadata:
  name: grafana-local-queue-reader-binding
subjects:
  - kind: ServiceAccount
    name: default
    namespace: default
roleRef:
  kind: ClusterRole
  name: grafana-local-queue-reader
  apiGroup: rbac.authorization.k8s.io
应用适当的配置:
kubectl apply -f <filename>.yaml
步骤 2:生成服务账号令牌
为 Grafana 创建身份验证令牌:
TOKEN=$(kubectl create token default -n default)
echo $TOKEN
保存令牌,以便在步骤 5 中使用。
步骤 3:为 Grafana 设置端口转发
本地访问 Grafana :
kubectl port-forward -n monitoring service/grafana 3000:3000
Grafana 现已在 http://localhost:3000 可用。
步骤 4:安装 Infinity 插件
- 打开 Grafana,访问 http://localhost:3000。
- 登录(默认凭据:admin/admin)。
- 转到
Connections>Add new connection。 - 搜索
Infinity并点击Install。
步骤 5:配置 Infinity 数据源
- 转到
Connections>Data sources并点击+ Add new data source。 - 选择
Infinity。 - 配置数据源:
- 认证:设置
Bearer Token为步骤 2 中生成的令牌。 - 网络:启用
Skip TLS Verify。 - 安全性:添加
https://kubernetes.default.svc到允许的主机,并将Query security设置为Allowed。
- 认证:设置
- 点击
Save & test以验证配置。
步骤 6:导入待处理工作负载仪表板
- 下载适当的仪表板 JSON:
- 在 Grafana 中,转到
Dashboards>New>Import。 - 选择
Upload dashboard JSON文件并选择下载的文件。 - 选择在步骤 5 中配置的 Infinity 数据源。
- 点击
Import。
步骤 7:设置 ClusterQueue
要配置一个基本的 ClusterQueue,应用以下内容:
apiVersion: kueue.x-k8s.io/v1beta2
kind: ResourceFlavor
metadata:
  name: "default-flavor"
---
apiVersion: kueue.x-k8s.io/v1beta2
kind: ClusterQueue
metadata:
  name: "cluster-queue"
spec:
  namespaceSelector: {} # match all.
  resourceGroups:
  - coveredResources: ["cpu", "memory"]
    flavors:
    - name: "default-flavor"
      resources:
      - name: "cpu"
        nominalQuota: 9
      - name: "memory"
        nominalQuota: 36Gi
---
apiVersion: kueue.x-k8s.io/v1beta2
kind: LocalQueue
metadata:
  namespace: "default"
  name: "user-queue"
spec:
  clusterQueue: "cluster-queue"
应用配置:
kubectl apply -f https://kueue.sigs.k8s.io/examples/admin/single-clusterqueue-setup.yaml
步骤 8:创建示例工作负载
要向仪表板填充数据,创建示例作业:
apiVersion: batch/v1
kind: Job
metadata:
  generateName: sample-job-
  namespace: default
  labels:
    kueue.x-k8s.io/queue-name: user-queue
spec:
  parallelism: 3
  completions: 3
  template:
    spec:
      containers:
      - name: dummy-job
        image: registry.k8s.io/e2e-test-images/agnhost:2.53
        command: [ "/bin/sh" ]
        args: [ "-c", "sleep 60" ]
        resources:
          requests:
            cpu: "1"
            memory: "200Mi"
      restartPolicy: Never
多次应用该作业:
for i in {1..6}; do kubectl create -f https://kueue.sigs.k8s.io/examples/jobs/sample-job.yaml; done
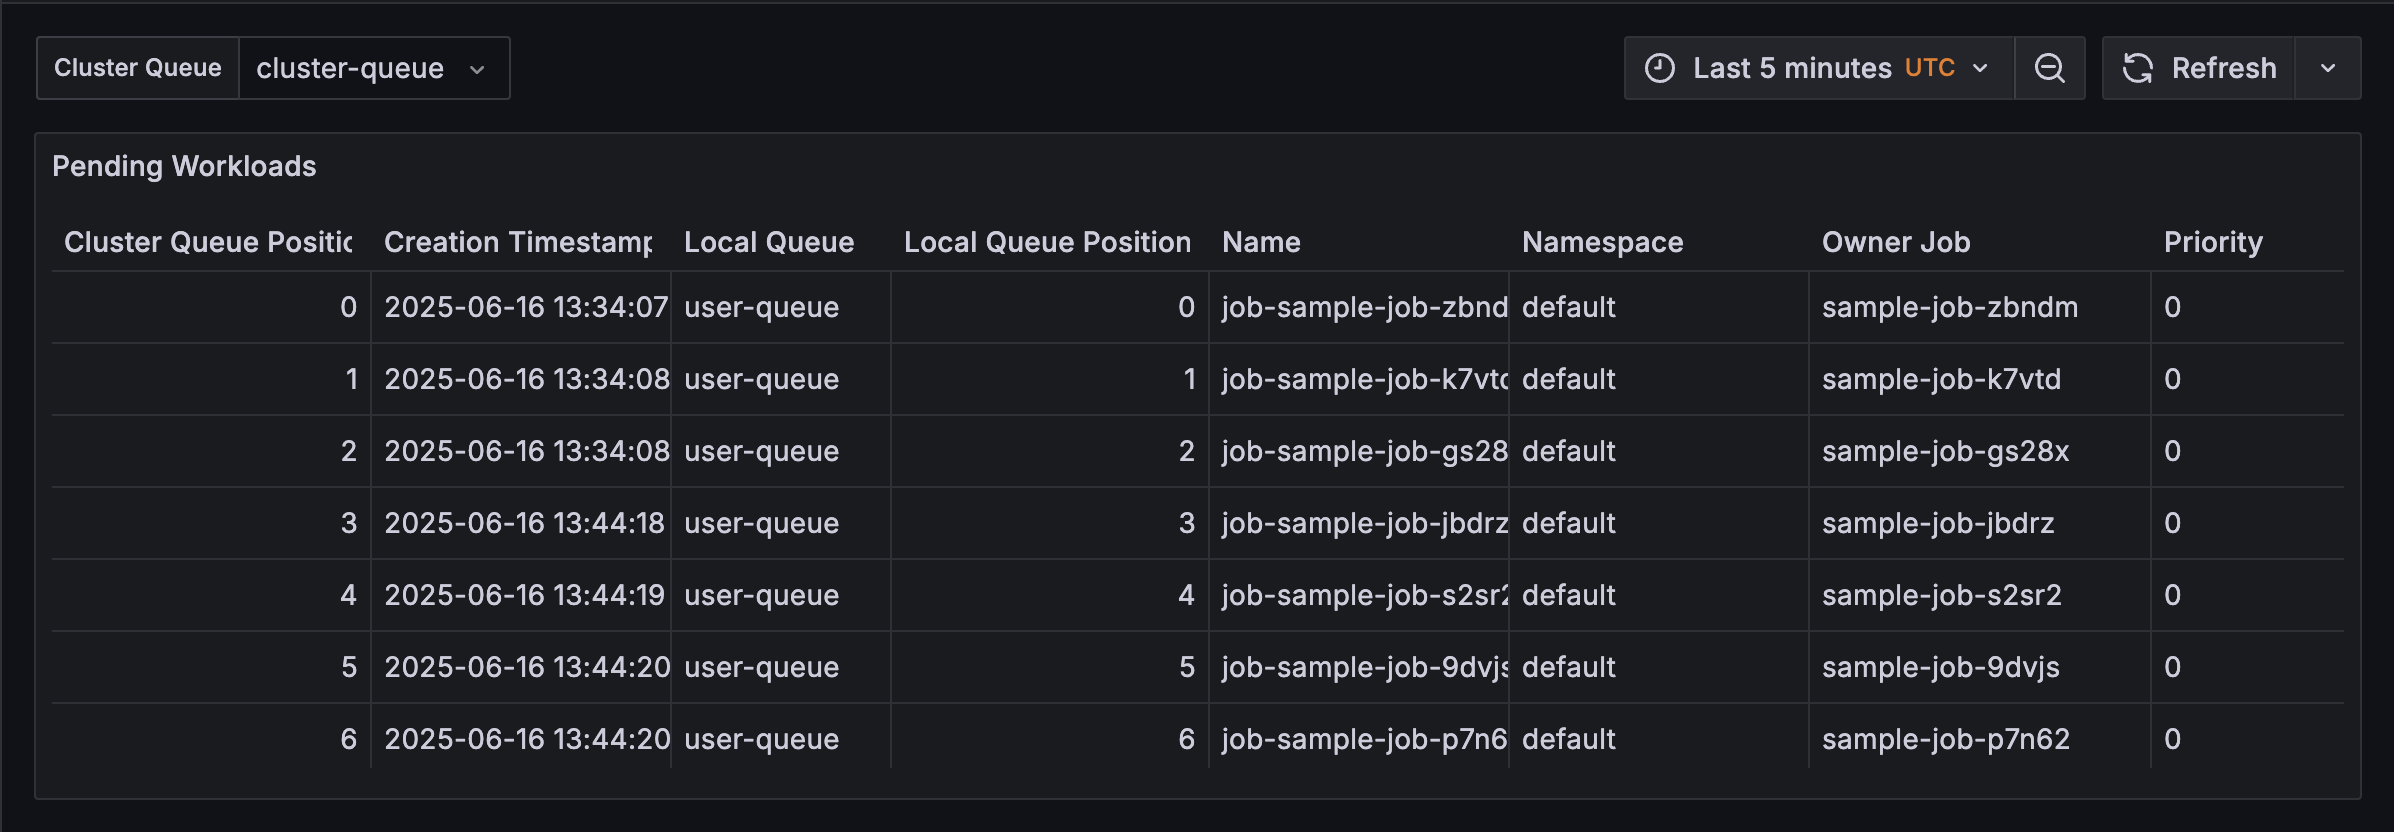
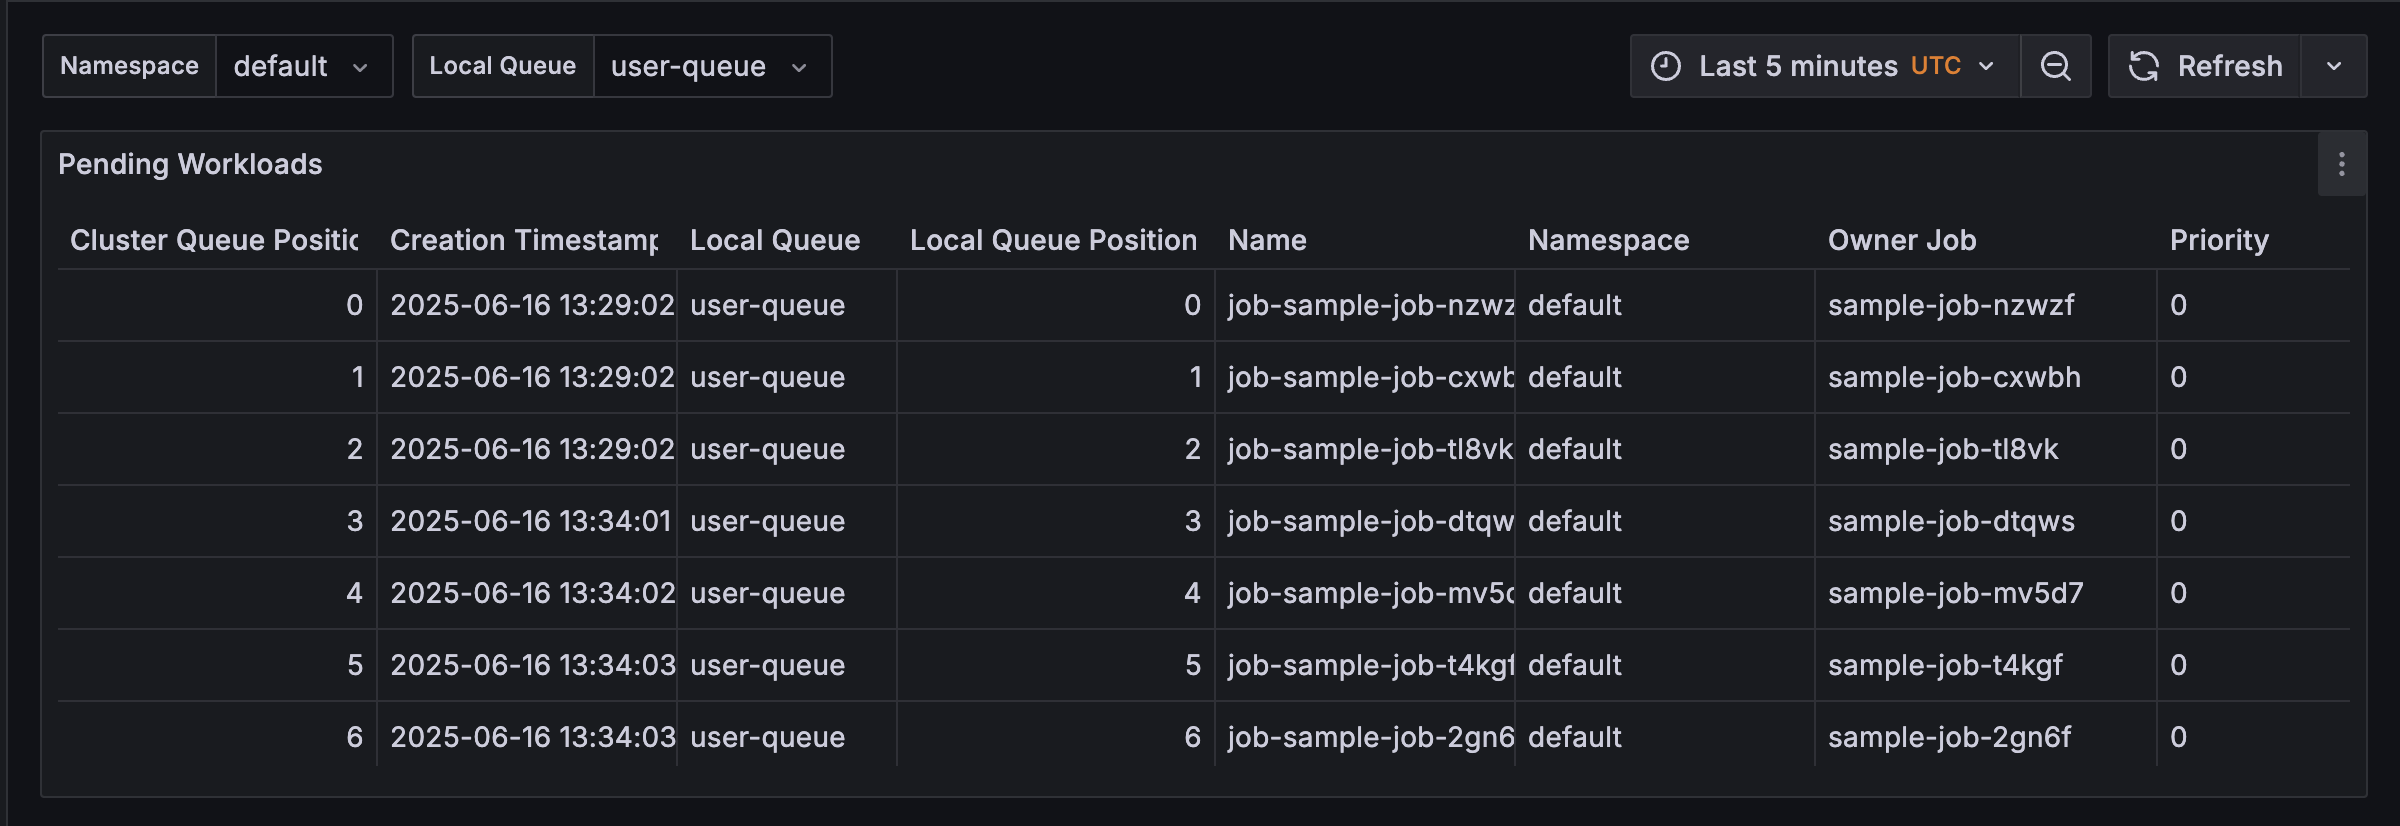
步骤 9:查看仪表板
- 在 Grafana 中,导航到
Dashboards。 - 选择导入的仪表板(例如,“ClusterQueue 可见性的待处理工作负载”)。
- 确认显示了待处理的工作负载。
故障排查
仪表板中无数据
确保已创建作业并且正确配置了 Infinity 数据源。
权限错误
验证是否正确应用了 ClusterRole 和 ClusterRoleBinding。
无法访问 Grafana
检查端口转发并确保 Grafana 服务在 monitoring 命名空间中运行。
反馈
这个页面有帮助吗?
Glad to hear it! Please tell us how we can improve.
Sorry to hear that. Please tell us how we can improve.